Trading Psychology: 10 Biases to Avoid!


Especially when money is on the line and time is scarce, human decision making can be very flawed. Trading is one of the fields where erroneous and irrational behavior patterns are especially common. In this article, we’re going to look at the most common cognitive biases and irrational decision making patterns, and how to avoid them.
Being aware of these thinking flaws has two main advantages. Firstly, it helps you avoid them in your own trading, and secondly, it can help you identify and explain seemingly irrational market behaviors caused by these biases.
Trading Psychology: 10 Biases to Avoid!
Most of these so-called cognitive biases were discovered and introduced by the Nobel prize-winning Daniel Kahneman and Amos Tversky.
Gambler’s Fallacy
The first cognitive bias that I want to talk about is the gambler’s fallacy.
The gambler’s fallacy is incorrectly over or understating the likelihood of an event based on a series of past events. This can be illustrated with a simple example of a coin flip. The probability that a coin will land on heads is 50%. No matter how often you flip a coin, this probability does not change. So even if your coin just landed on heads 10 times in a row, this does not affect the probability of the next coin flip.
As the name implies, the gambler’s fallacy is especially common in gambling. When a roulette wheel ended on red for the past 10 rounds, people prefer betting on black even though the odds of red and black are identical.
This pattern of thinking is quite common in trading as well. Let me give you two examples.
Have you ever opened a long position because a stock had many consecutive down days or vice versa? If so, you have fallen prey to the gambler’s fallacy.
Another example would be the reaction to losing or winning streaks. If you ever felt that after many consecutive wins, the chances of losing increased and you decreased your position size, you have been guilty of the gambler’s fallacy.
The odds of winning on a trade don’t magically change just because you had multiple losses or wins before this trade.
Winning Streaks
Speaking of winning streaks, if we assume that you have found a trading strategy that guarantees you a 70% chance of winning on every single trade, what do you think the odds of winning 10 times in a row are?
The answer is under 3%.
In fact, even the probability that you will have 2 consecutive wins with this strategy is under 50%. This means that it is less likely that you will have 2 consecutive winners than that you won’t.
And remember, this is with a strategy that guarantees you a 70% chance of success on each trade. Most strategies won’t have nearly as good odds.
Here is a diagram that shows the probability of different-sized winning streaks for this strategy.
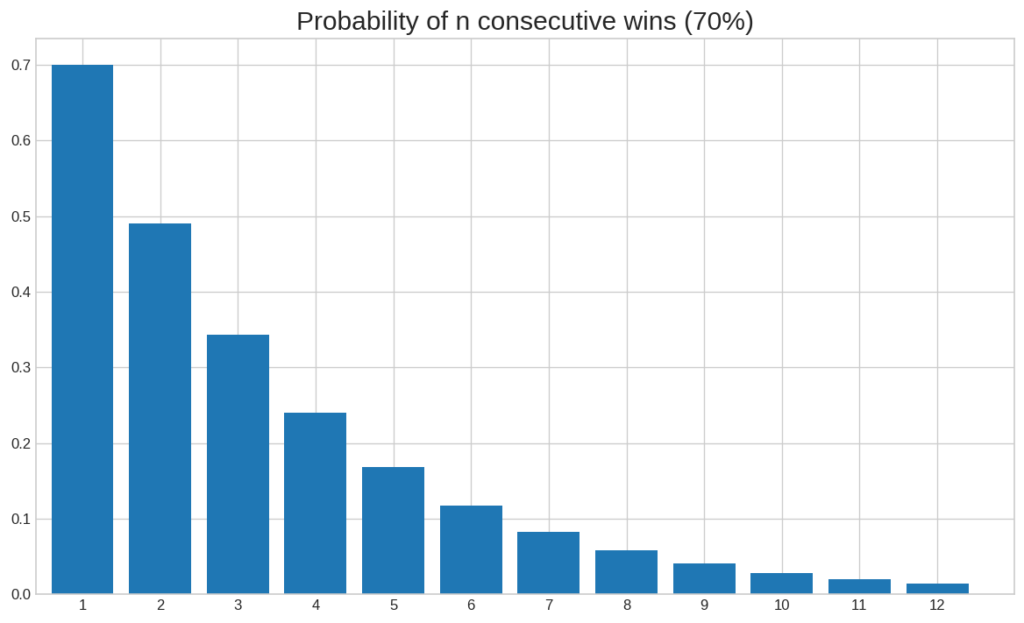
To calculate the probability of n consecutive wins, you simply have to take the estimated odds of your trading strategy to the power of n. Note that this assumes that your trades are independent of each other and the probability of winning is constant. Whether these assumptions are realistic is a topic for a different article.
If we take a look at the odds of losing streaks, we get a similar picture. Here is a diagram that shows the probabilities of multiple consecutive losses with a trading strategy that has a 40% chance of losing on any single trade.
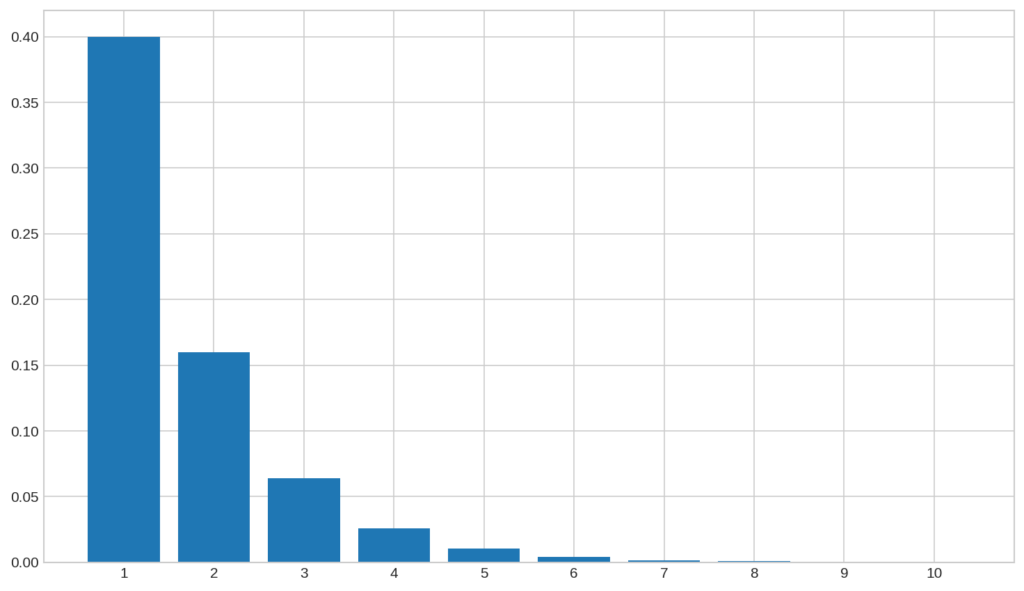
As you can see, with a 40% chance of losing, it is extremely unlikely that you will have more than a handful of losses in a row.
So what can we learn from this?
Firstly, no matter how good your strategy is, losses do happen. You can’t win all your trades. Therefore, you have to implement solid risk management practices and keep the size of your losses under control.
Next up, the odds of having many losses or wins in a row is quite low. So if you often have more than 10 major consecutive losses, you should seriously start doubting the quality of your trading strategy.
But always remember, even though the probability of winning 10 trades in a row is very low, the probability of winning on any single trade is not lower just because you won on the last 10 trades.
Confirmation Bias
Next up, let’s take a look at our next cognitive bias, namely the confirmation bias. Confirmation bias is the tendency to seek out information that confirms your preexisting beliefs. This is a bias that without a doubt, the vast majority of traders have been guilty of.
After opening a trade, it is only natural to continually seek out information that confirms your trade idea. You might look at dozens of indicators and social media posts and only focus on those that confirm your beliefs. Finding something that agrees with you is a good feeling and certainly can boost your confidence in that position. The problem is that by doing this, you often ignore signs that your trade wasn’t the best idea and something might be wrong. Instead, you convince yourself more and more that everything is fine. By searching Twitter for a ticker symbol, you are almost guaranteed to find at least a few people that have the same market assumption as you.
One way to avoid confirmation bias in trading is by having a clear set of indicators and rules to follow for your trades. If you have such a clear set of rules and indicators, there is no need to go look for any other confirming signs. Furthermore, it is best to avoid social media as a trade decision making guide.
Law of Small Numbers
That said, let’s move on to our next fallacy. The next fallacy is the law of small numbers. You might have heard about the law of large numbers that states that the average of growing sample sizes converge to the actual mean of the total population.
Here is a graph that shows this convergence on the example of a dice roll.
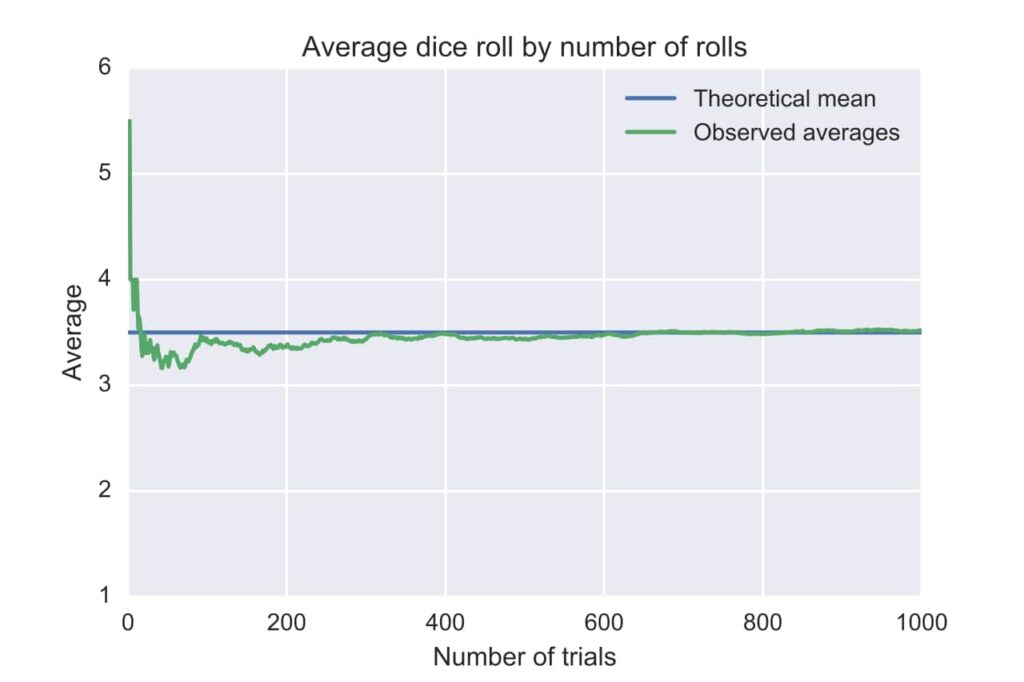
This is a very powerful rule in probability theory that allows you to estimate a population’s parameters with large enough samples. But as the name implies, this only works for big sample sizes. This is where the fallacy of the law of small numbers comes into play. Most people intuitively use the law of large numbers incorrectly, namely with way too small sample sizes.
Let me give you an example.
Have you ever tried a trading strategy for a handful of trades and then concluded that it doesn’t work. If so, you have been guilty of using the law of small numbers. A few trades is not a big enough sample size to give you any significant information about the quality of a trading strategy.
Let me tell you how you can avoid the law of small numbers by showing you how to efficiently test the effectiveness of a trading system:
The goal is to use this trading system for at least 20 trades. It might seem scary to use a new trading system for over 20 trades when you have no idea how good or bad it might perform. Therefore, you should trim down your risk to a level so that you could easily afford to lose on all of these 20 trades. Your goal with these trades is not to make money, but to test out a given strategy.
When making these 20 trades, try to be as mechanical as possible. Create clear rules for every market scenario imaginable and follow these rules on every trade. If you don’t have a clear set of rules to follow, you can’t reliably test your strategy since there is no strategy to test.
Furthermore, make sure to keep a detailed and thorough trade journal. After every trade, track entry price, exit price, profit potential, money at risk, time in the trade, and more.
After you have followed these steps for at least 20 trades, you are ready to evaluate the strategy. Ideally, you should now have a rich collection of data on this strategy to evaluate it and make an informed decision on how effective this trading system is.
I know that this might seem like a lot of work just to test a trading system, but without having a big enough sample size, you can’t really evaluate anything.
The goal of this example was to illustrate how you can make informed decisions based on a collection of data. Besides testing a new strategy, this approach can be used for other decisions as well.
Making a decision based on one or two occurrences is like saying roulette has a 100% win rate because you won one round.
Survivorship Bias
The next cognitive bias that we are gong to look at is the survivorship bias.
Wikipedia defines survivorship bias as:
“The logical error of concentrating on the people or things that made it past some selection process and overlooking those that did not, typically because of their lack of visibility.”
Let’s, once again, look at a couple of examples to better understand what this means.
If you look around, it is easy to arrive at the conclusion that most ETFs, mutual funds, and even individual stocks go up over time. But, in reality, that is an erroneous conclusion. That’s because the universe of funds and stocks that you look at is already skewed in one direction. One reason why a stock did not go up but instead fell is that it went bankrupt. And a bad performing fund usually gets closed after a few years.
In other words, only those funds survive that performed well enough. So when you say that most stocks or funds go up over time, you aren’t considering all those that didn’t survive. Therefore, the results obtained by only looking at survivors can be very flawed.
To give you some data, a Vanguard Group study recently found that a 1997 investor in a large-cap growth or value fund only stood a 22% chance of finding a fund that would survive and outperform its benchmark 15 years later. Out of the over 5000 available funds, only 54% survived of which 19% outperformed their benchmark. The remaining funds either got merged or liquidated.
The problem of only considering a universe of investments that survived a certain selection process is especially common when backtesting and analyzing trading strategies on historical data.
But also when analyzing success stories outside of trading, survivorship bias can be a big problem. The results of looking at shared traits of highly successful people doesn’t actually yield very significant results. Typically many unsuccessful people also share these traits but they weren’t considered in such a study which can dramatically skew the results.
Often successful people succeed in spite of certain traits, not because of them.
The phrase that history is written by winners very much also applies to business and financial markets.
In general, when looking at and analyzing investments, make sure to think about what you can’t see. Is there a seemingly invisible filter that you are missing? If so, your results can be vastly skewed in an unwanted direction.
Correlation does not imply Causation
This brings us to our next common fallacy, namely mistaking correlation for causation. Correlation does not imply causation, but sadly it is often treated as if it does. There are different types of this fallacy. I will now cover 3 of the most prominent causation fallacies.
The first is reverse causation. An easy example of this is the correlation between rainy days and the usage of umbrellas. When it rains, people tend to use umbrellas much more. Does that mean that using umbrellas causes it to rain?
Of course not, it’s the other way around.
This might seem like an obvious mistake, but often things aren’t as clear. If, for instance, stock A and B are heavily correlated, does that mean that an up move in A’s price causes a rection in B’s price or the other way around?
Another causation bias is neglecting the fact that a third variable might be the cause of two correlated variables. For example, two oil stocks might be highly correlated. But this doesn’t mean that a move in one of the stocks causes a move in the other stock. Instead, a third variable, namely the price of oil might be the cause for the moves in both of these stocks.
Last but not least, two variables can also be correlated without having any causal link. In fact, if you have a big enough set of data, you are almost guaranteed to find some variables that are correlated purely by chance.
One example of such a coincidental correlation is the correlation between the per capita consumption of chicken and US crude oil imports. These two variables have a historic correlation of almost 90% over about 10 years. Nevertheless, I wouldn’t use chicken consumption data to try to predict US crude oil imports.
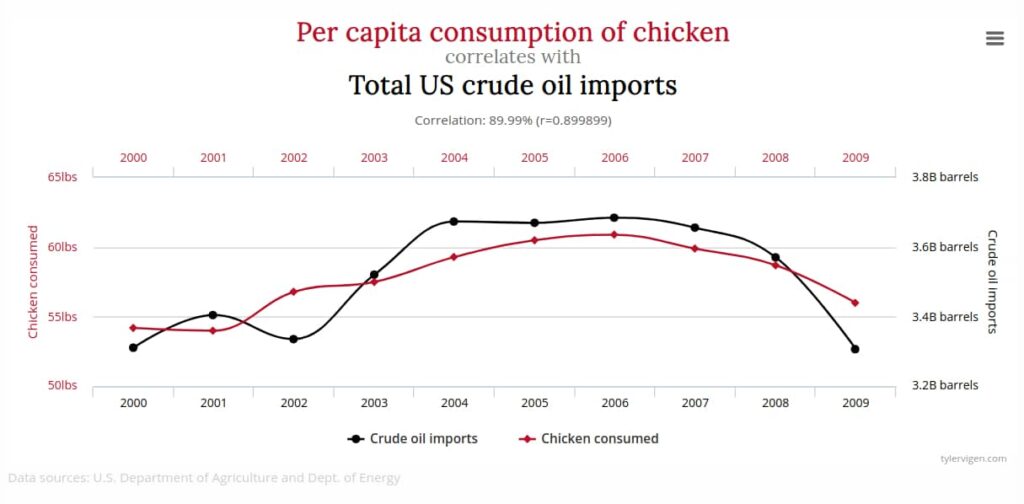
There are countless similar examples of seemingly nonsensical correlations. So going forward, never assume that correlation means causation. Proving correlation is very straightforward, but proving causation is a totally different story.
Hindsight Bias
With that being said, let’s move on to the next cognitive bias, namely hindsight bias. Hindsight bias is the tendency of overstating the odds of an event that has already happened. Here is a great quote from Nobel prize-winning Daniel Kahneman about hindsight bias:
“A stupid decision that works out well becomes a brilliant decision in hindsight.“
— Daniel Kahneman
In my opinion, hindsight bias is especially common amongst traders. Way too many traders evaluate the quality of their trades based on their outcome. This is a very flawed way of evaluating your trades. A trade that has a 70% chance of making $200 and a 30% chance of losing $100 is without a doubt a great trade, no matter its outcome. Even such a trade won’t work out 3 out of 10 times, but that doesn’t make it a bad trade. Sadly, this is how many traders evaluate their trades.
Hindsight bias is also one reason why technical analysis seems so attractive. Finding chart patterns on historical charts is very easy, but without the benefit of hindsight things aren’t nearly as easy.
If you ever felt that a past price move seemed so obvious, you have fallen prey to the hindsight bias.
To avoid hindsight bias, you need some way of evaluating your trades not based on their outcome. Instead, you should focus on the quality of your decisions along the way. Did you have a clear trade plan and strategy? If so, did you follow it? If not, why not and what could you do better next time?
In general, it is best to have a consistent way of evaluating your trades that is not affected by the outcome of your trades.
Recency Bias
Another common bias is the recency bias. Recency bias the illogical way of putting more weight and importance to recent events compared to historical ones. This can easily be observed by looking at the cyclical nature of markets. The longer a bull market is, the more and more people forget that prices don’t only go up. Thus, investors pay less and less attention to their risk even though it should be the other way around since the further prices rise, the more they can fall.
The same is the case directly after market crashes. This is when people typically overmanage their risk because they overestimate the odds of future drops. This can be a great time to sell overpriced insurance products such as options and volatility.
Attribution Bias
A different bias that can be observed in the trading news business is the attribution bias. The attribution bias is the bias of constantly trying to assign some reason to an event, even if your reason has nothing to do with reality. Financial news companies are in the business of satisfying this bias. They seem to have an explanation for every single price move even if their explanations sometimes are contradictory.
Sometimes, you can’t break down a price move into a simple cause and effect relationship. But this doesn’t stop us from trying. The problem is that humans are very good at finding an explanation for almost anything even if the explanation doesn’t make sense. Basing trades on these explanations can do more harm than good.
So make sure to be careful when looking at the reasons that financial news organizations assign to certain price moves.
The best explanation for an up move will always be that there simply are more buyers than sellers.
Sunk Cost Fallacy
Last but not least, let’s briefly look at the sunk cost fallacy. If you ever have held on to a position far longer than you should have, you have been guilty of this fallacy. The sunk cost fallacy is the tendency to refuse to stop an action because you have already sacrificed a good amount of money and/or time into it. Sometimes, it is best to just cut your loss than to further waste money and time on a project or trade. Sunk costs should not be a reason for you to continue staying in a trade.
If you wouldn’t open your trade at its current price level, you should not stay in it, regardless of how much you already have lost.
One way of combating the sunk cost fallacy is by having a clear trade plan with clearly defined exit points before you enter a trade.
How to Avoid Cognitive Biases in Trading
We have now covered a wide variety of different cognitive biases that can dramatically impact your trading and decision making in general. Let us now briefly look at how you can avoid these biases.
First and foremost, it is already a good step in the right direction to be aware that these biases exist. But sadly, simply being aware isn’t enough to completely avoid them. In fact, it is almost impossible to fully eliminate these biases from your life since they are so deeply ingrained in your human psychology. That said, you can definitely do things that can reduce the frequency of them and thereby improve the quality of your decisions.
One thing that can dramatically increase the likelihood of using a cognitive bias is trying to make decisions under time pressure. So avoiding time pressure is another step in the right direction. One way of avoiding time pressure in trading is by preparing beforehand. Instead of trying to improvise and rely on your intuition, always have a clear trade plan before you open a trade. The trade plan should have all the information you need to mechanically carry out your entire trade.
Besides having a trade plan, a good trade journal is another way for you to improve upon your decision making and trading.
Otherwise, try to actively monitor yourself for these cognitive biases. Especially in situations where the likelihood of a bias is high, step back and rethink the entire situation from another perspective.
Furthermore, avoid making important decisions when you are in a bad mood or not fully focused due to a lack of sleep, for instance.
If you are interested in learning more about this topic, make sure to check out Daniel Kahneman’s book, “Thinking Fast and Slow”.
If you have any questions or comments, definitely let me know in the comment section below.
This content was originally published here.
Options Strategies – A Mentorship Program
On September 01, 2019, We have launched a new mentorship program for Option strategies, in which we’ll discuss how can we deploy these Options strategies? What rules we should follow before taking a trade? And what should be our adjustments if the script is moving against your direction?