
Trading Strategies with Weekly Chart Analysis for November 17th Expiry


Hello guys, I hope you are doing well. In this edition of our weekly market newsletter (Weekly Indian Market Outlook), I will cover the weekly Indian market outlook, weekly chart analysis of the Nifty and BankNifty, and options trading strategies for weekly income.
Before getting started on our weekly chart analysis and option trading strategies, let’s talk about one of the main components of successful trading that the majority of people don’t know and end up losing huge amounts of money. That is “Importance of Risk Management.”
Book your seat for Mentorship program 3.0
5 Common Mistakes in Risk Management:
Risk management is essential for any trader or investor. The risks associated with trading can be huge, and there’s a lot that can go wrong. If your risk-management strategy is ineffective, you could end up losing a lot of money in the long term.
It might seem like a simple task to keep track of your risks, but there are things you can do to reduce the potential impact of those risks on your trading account. Keep reading to learn more about the top 5 mistakes in risk management and how to avoid them.
1. Don’t Define Your Risk Tolerance In Terms Of Layers
Defining your risk tolerance in terms of layers may seem like a great idea at first. After all, it’s much more fitting than simply saying “I’m 50% confident with this trade,” right?
The problem is that layers are not a good way to measure risk. The risk of a trade is not based on the number of layers you place in the market; it’s based on the expectation of profit or loss.
By definition, a layer is the amount of money that the market will have to go in your favor before you’ll make a profit. If the market has to go against you before it goes in your favor, it’s not a risk.
Only Focus On The Trades You’re Accepted For
Accepted trades are an important part of your risk management strategy. However, traders should not exclusively focus on these trades, as this will lead to poor risk management decisions.
Accepted trades are only a small part of your overall trading strategy. You should also consider other factors, including the amount of your trading account equity, the expected volatility of the market, and your trading strategies.
If you only look at your accepted trades, you may end up trading with too much risk in the long run.
Assume The Market Will Move In Your Favor
While it’s true that traders should assume that the market will move in their favor at some point, this should not be the only consideration in your risk management strategy.
It’s easy to convince yourself that the market will always move in your favor if you don’t account for all of the risks involved in trading. If you assume that the market will always move in your favor, you may double the amount of your trading account.
This will make it much easier for you to lose money. You should assume that the market will not always move in your favor, but that doesn’t mean you should not account for all of the risks involved in trading.
Don’t Understand How Leverage Affects Your Returns
Understanding how leverage affects your returns is one of the most important parts of risk management. Many traders assume that they can take on more risk with leverage, but this is not the case.
This is because the amount of risk you assume increases as well. If you assume a small amount of risk and use a high amount of leverage, it will be very difficult to make money.
However, if you assume a large amount of risk with a small amount of leverage, it may be possible to lose a large portion of your trading account.
If you take on a large leverage with a small amount of capital, it may be caused you a large return. However, if you take on a smaller amount of risk with a larger amount of capital, it’s more likely that you’ll be a successful trader soon.
You should assume a large amount of risk comes with a high amount of leverage. You should also understand the risk involved.
Always Be Looking For Opportunities To Sell
Traders often assume that they should always be looking for opportunities to buy. While this is a good strategy to use when trading, it’s also important to look for opportunities to sell. If you always assume that there are opportunities to buy, you may end up pushing your trading account too far in the red.
You should look for opportunities to buy but don’t miss the opportunities to sell when you’re long. It’s important to keep a balanced trading account, as long as you don’t let all of your money go into certain stocks.
You should always look for opportunities to buy, as well as opportunities to sell, to keep your trading account balanced.
I hope these tips have been helpful. Remember, a volatile market can be challenging, but with the right approach, you can still be successful.
Weekly Chart Analysis and Options Trading Strategies:
The market had a gap-up opening to the week and experienced low volatility compared to the previous few weeks this whole week. However, on Friday, Nifty gave a bullish sign that enabled Nifty to close with a weekly profit of 1.28% and BankNifty to close with a profit of 2.13%.
Weekly Chart Analysis of Nifty and BankNifty
Now let’s look at the weekly chart first to know the important levels:
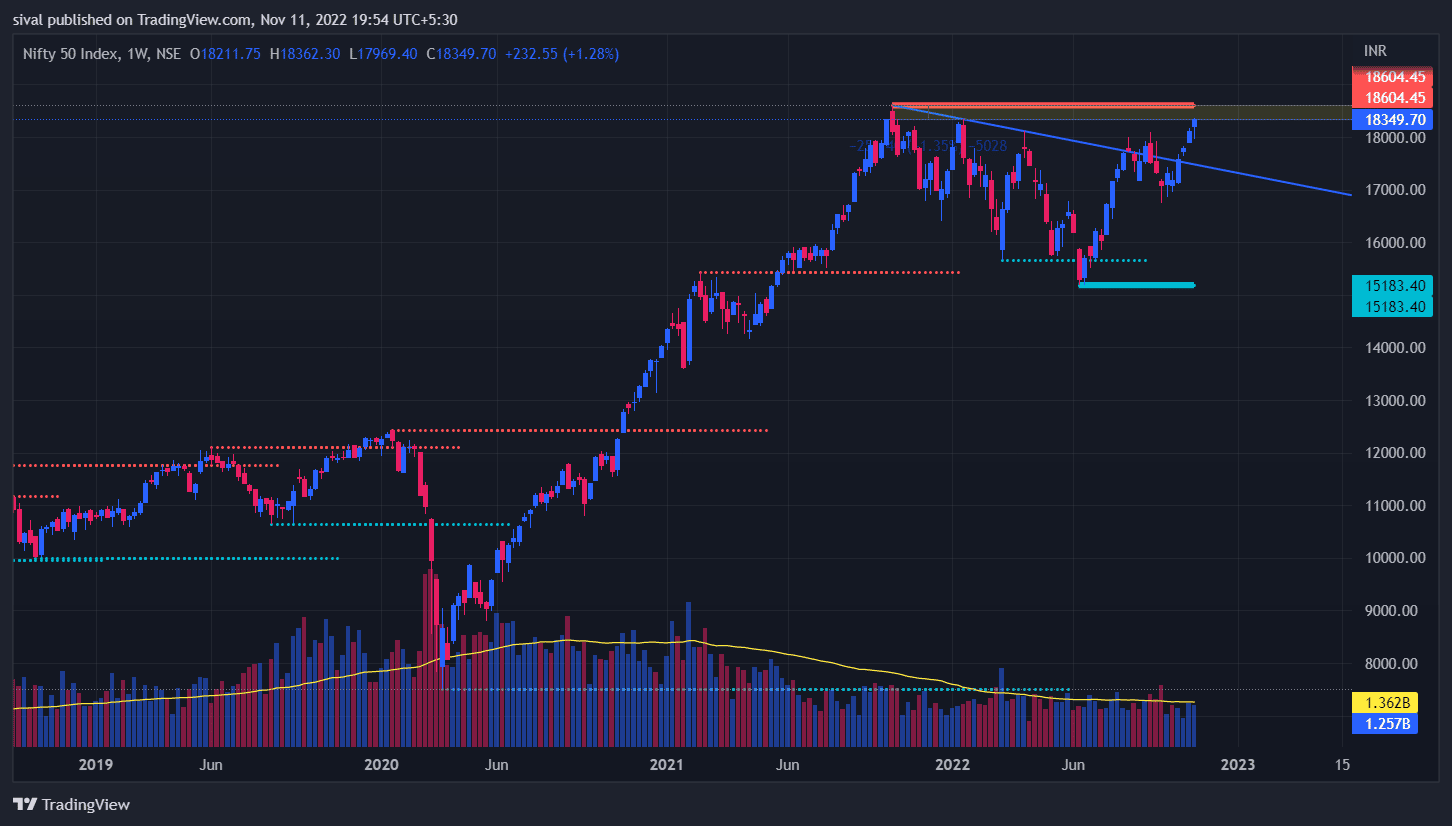
If you look at the weekly charts of Nifty and BankNifty, you can easily find that both indices have been trading near their resistance zones. However, Banknifty has given a breakout from the resistance and closed above 41800 with decent volumes. But Nifty is still trying to give a breakout.
So we can say that the sideways trend in BankNifty is turning bullish to hit new highs in the coming trading sessions. but Its too early to initiate any long trade here. So let us wait for one more week. If BankNifty manages to sustain above this breakout then only we should initiate a long trade.
Now let us look at the daily chart.
Daily Chart Analysis of Nifty and BankNifty

Let’s start with the Nifty chart first. The Nifty opened with a gap-up and closed above its important resistance level of 18100. and managed to stay above that level, which is a good sign for the bulls but facing resistance around 18350.
Now, this 18350 to 18600 is the range that is important in terms of further upside. A breakout from 18600 is required to initiate a new long trade in Nifty.
Trade Plan for the coming week: If the Nifty manages to stay above 18600 this week, you can place a long bet above that level. Else trade with a range-bound strategy. I will share my Intraday in our telegram channel. Join through the below button.
Click here to join FREE Telegram Channel
BankNifty is also giving the same setup as Nifty is showing on the chart. Gave a breakout from its important resistance level, i.e., 41800. If we manage to sustain above 41800, then it will open new upside levels in the coming sessions.
Important levels to keep on the radar this week in BankNifty is 41800. In BankNifty, initiate a long trade if BankNifty manages to sustain above 41800.
Tip for the week: Don’t go long or short very aggressively. Let market give a proper indication and then entre in any trade. Go long above 41800 only if banknifty manages to sustain above 41800 level.
If you are trading intraday and wanted to know how I’m taking my trades then you must join our Telegram Channel. In this FREE Telegram channel, Daily I’m sharing my personal trades and the logic behind these trade.
Click here to join FREE Telegram Channel
Options Trading Strategies for the Coming weekly expiry
In the above section. we have analyzed the chart and found the range based on the chart. Now before we create any strategy, let’s look at the open interest data to check the range for the coming week.

- Nifty Open Interest Analysis:
- Highest OI is at 18000 PE & 19000 CE. The support is at 17800 & Resistance is at 19000 for the coming weekly expiry.
- Max pain is at 18300.
- BankNifty Open Interest Analysis:
- Highest OI is at 42000 PE & 44000 CE. The support is at 41500 & Resistance is at 43000 for the coming weekly expiry.
- Max pain is at 42000
Based on the OI data, the range is very wide but dee to low volatility premiums are also very low. So today, I’m sharing a premium strategy that has a high probability of success in BanKnifty only.
Options Trading Strategies for the Coming weekly expiry

You can see this strategy has a 62% probability of success. For risk management, you can keep a stop loss of ₹8000 as MTM loss.
We teach this strategy in our course. You can enroll to learn the weekly expiry strategy with predefined rules of entry and exit.
Learn weekly expiry strategies
If you want to learn these options trading strategies and their adjustments in more practical ways with live mentorship, You can enroll in our Option Strategies – A Mentorship Program.
Much Check this also-
- Deploying short strangle by looking profit/loss at the payoff chart? – A must read for beginners!
- Why is psychology important in options trading?
- 3 Simple Options Strategies for High Volatility
Post your comments in the comment box if you have a query related to this weekly Indian Market Outlook. You can ask any question related to options trading in the comment box.
If you need more real-time assistance on the Nifty and Bank Nifty weekly expiry strategy or want to deploy these hedging trading strategies for monthly Income, Can take our premium subscription and you will get real-time assistance every month on these Options trading strategies. You can contact us on WhatsApp.
Options Strategies – A Mentorship Program 3.0
Learn About Trading Options in a course led by an Industry Expert. It doesn’t matter how old you are, the mentorship program is open to everyone who wants to learn more about the various option trading strategies. You’ll learn everything you need to know about these strategies and more. Don’t wait, Enroll today!
Learn Option strategies with Sachin Sival
DISCLAIMER: We are not a SEBI research analysts. Views and trading strategies are posted in this weekly market newsletter only for educational purposes. There is no liability whatsoever for any loss arising from the use of this product or its contents. This product is not a recommendation to buy or sell, but rather a guideline to interpreting specified analysis methods. This information should only be used by investors and traders aware of the risk inherent in securities trading.