
Weekly Analysis of Nifty and Bank Nifty with Best Weekly Option Strategies
Nifty & Bank Nifty headed up or down? Discover profitable weekly option strategies based on in-depth analysis.

Hey Folks! I hope you are safe and healthy. This is our first weekly post of the Year 2024, and I wish you a pleased and prosperous New Year. I started this weekly analysis 5 years back, and you guys gave so much love to this weekly newsletter.
Like always, today also we will start this weekly newsletter with an important topic. Today we will talk about something essential if you are trading with options in this stock market.
Any guess what it is?
let me tell you, It’s Volatility. Volatility has a direct impact on the Options premium. When the IV is high, the option premium will also be high, and the Option premium will be low if the IV is low. You can use Volatility to choose a stock for your Option strategies.
It's a deciding factor about "When to sell options or when to buy options?"
A stock with high volatility means you will get a good premium from your credit spread, and if the premium you have received is high, that means your risk will also decrease. Little confusing? Don’t worry. Let me show you this with a simple calculation.
Let’s assume you want to create a credit spread with a strike difference of 200 points. For example, You are buying 21500 PE at ₹20 and selling 21700 PE at ₹80 to create a Bull Put Spread. Now how can we calculate the maximum profit and maximum loss with this spread? Use the below formulas:
- Maximum Profit = Net Premium Received * Lot Size = (80-20) * 50 = 60 *50 = 3000
- Maximum Loss = (Spread – Premium Received) * lot size = (200 – 60) * 50 = 140 * 50 = 7000
So the maximum loss with the above strategy is ₹7000, and the maximum profit is ₹3000. We need to keep in mind that the spread is constant, and the only premium is the thing that can increase or decrease. Now let’s come to our initial question.
As we know if volatility increases, the premium will also increase. that means you will receive a higher premium. Now let’s say you are receiving ₹70 as net premium so the net loss will be ₹6500 {(200 – 70) 50} and the maximum profit will be ₹3500 (70*50).
I hope now you have understood how volatility impacts Option premiums. So the next time you are scanning stock for your options strategies always check its IV, i.e., implied volatility. Try to create credit spreads only on those stocks where IV is high.
By doing so, you can not only increase your probability of success but can reduce your overall risk too.
If you don’t know how to compare IV and scan stocks based on it, you can come to our Mentorship Program, where I will share with you a simple trick you can use to scan stocks. Click on the below button for more details:
Nifty weekly analysis and Option strategies
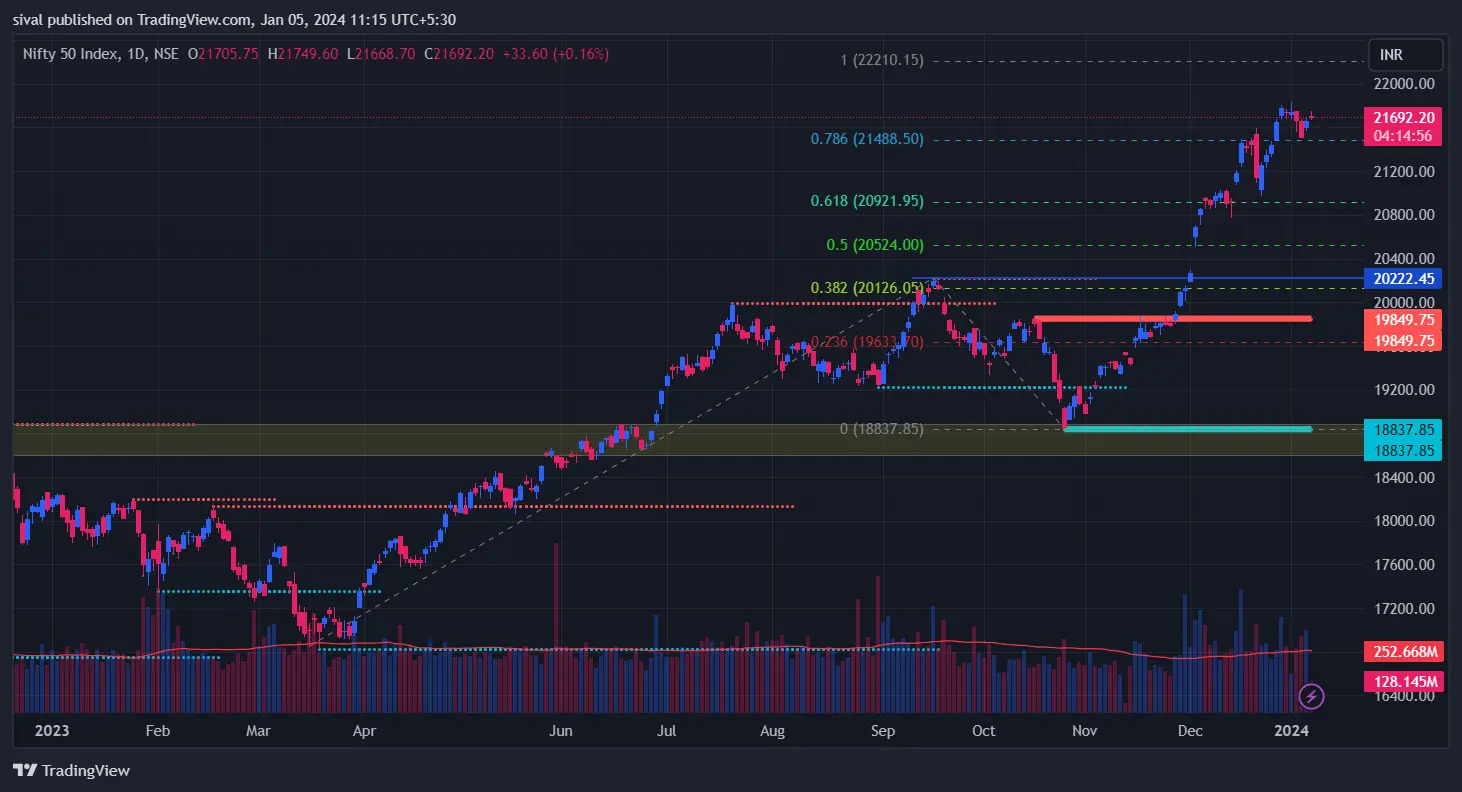
After a good upside rally, we saw Nifty was taking a pause this week. Nifty was traded in a range of 21500 - 21800 this week.
Despite this range-bound activity, we don't see much profit booking that indicates that Nifty is still holding its uptrend.
Now 21500 is acting as an immediate support level and if Nifty manage to hold this level, then we may see some more upside levels in the coming week.
If you look at the chart, you will find that Nifty is heading towards its next resistance level i.e. 22210. A breakout from the recent high i.e. 21834 will trigger a fresh long signal for the next upside target.
One more thing you should keep in mind here is that after this big rally, a profit booking may come. So trade with limited risk and keep your profit locked with trail stop-loss.
For the coming week, 21500 - 21800 is the neutral zone. And If you want to go long or short, I suggest you should wait for a breakdown or breakout from the given range.
So instead of taking any random trade, you should wait for a clear indication from the Market.
As I always say, “React based on the market movement instead of predicting it.”
So wait for a clear indication and take entry based on the signal.
Nifty Weekly Options Chain Analysis
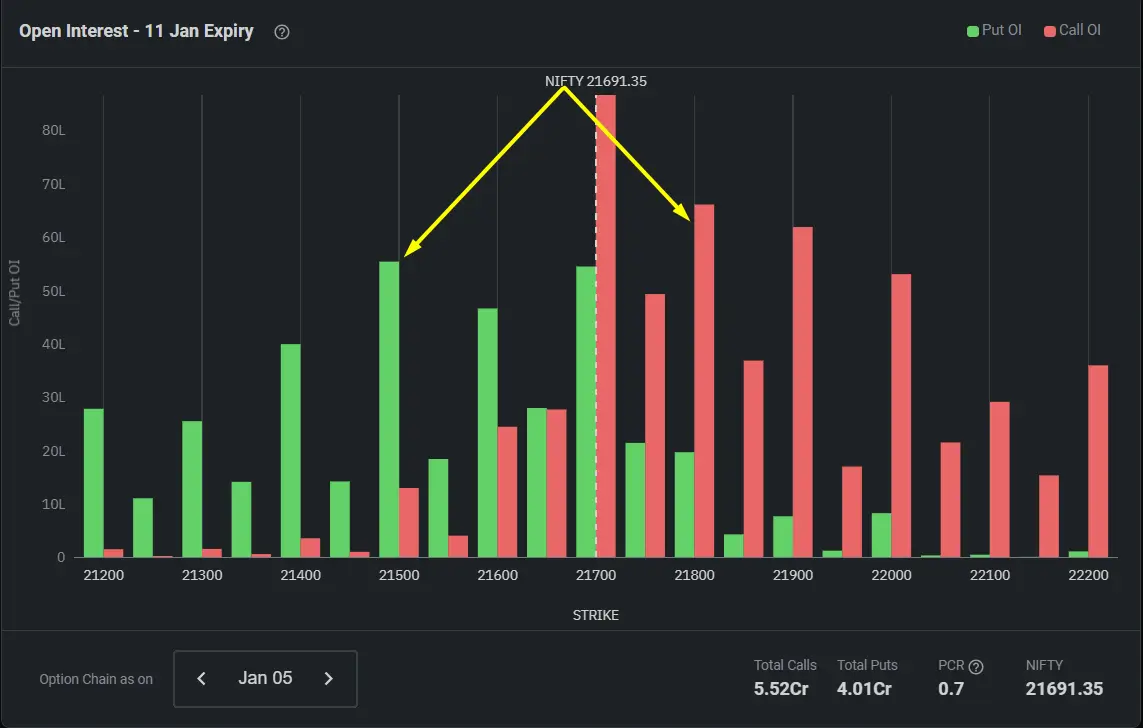
Based on option chain data, the highest Open interest stands at 21700 CE & 21500 PE, followed by 21800 CE & 21700 PE. PCR of all strikes is 0.7, which indicates a neutral market. PCR at 21500 stands at 4.26, which is acting as an immediate support level.
The Put-call ratio at 21800 stands at 0.3, which is acting as a resistance level. Equally, an important indicator, i.e., Option Pain, is at 21700, indicating weekly expiry at 21700. A shift in option pain will provide further levels.
e have seen significant open interest buildup on both sides indicating that nifty is facing good pressure from both sides and we may expect a range-bound activity based on the current option chain data.
But because the market is changing every day. So continuous monitoring is required to further levels.
So keep tracking open interest to analyze market participant's behaviour if you don’t know how to analyze open interest. Just enroll for our Option Strategies – A Mentorship Program.
Nifty Weekly Options Strategy: Advanced Iron Condor
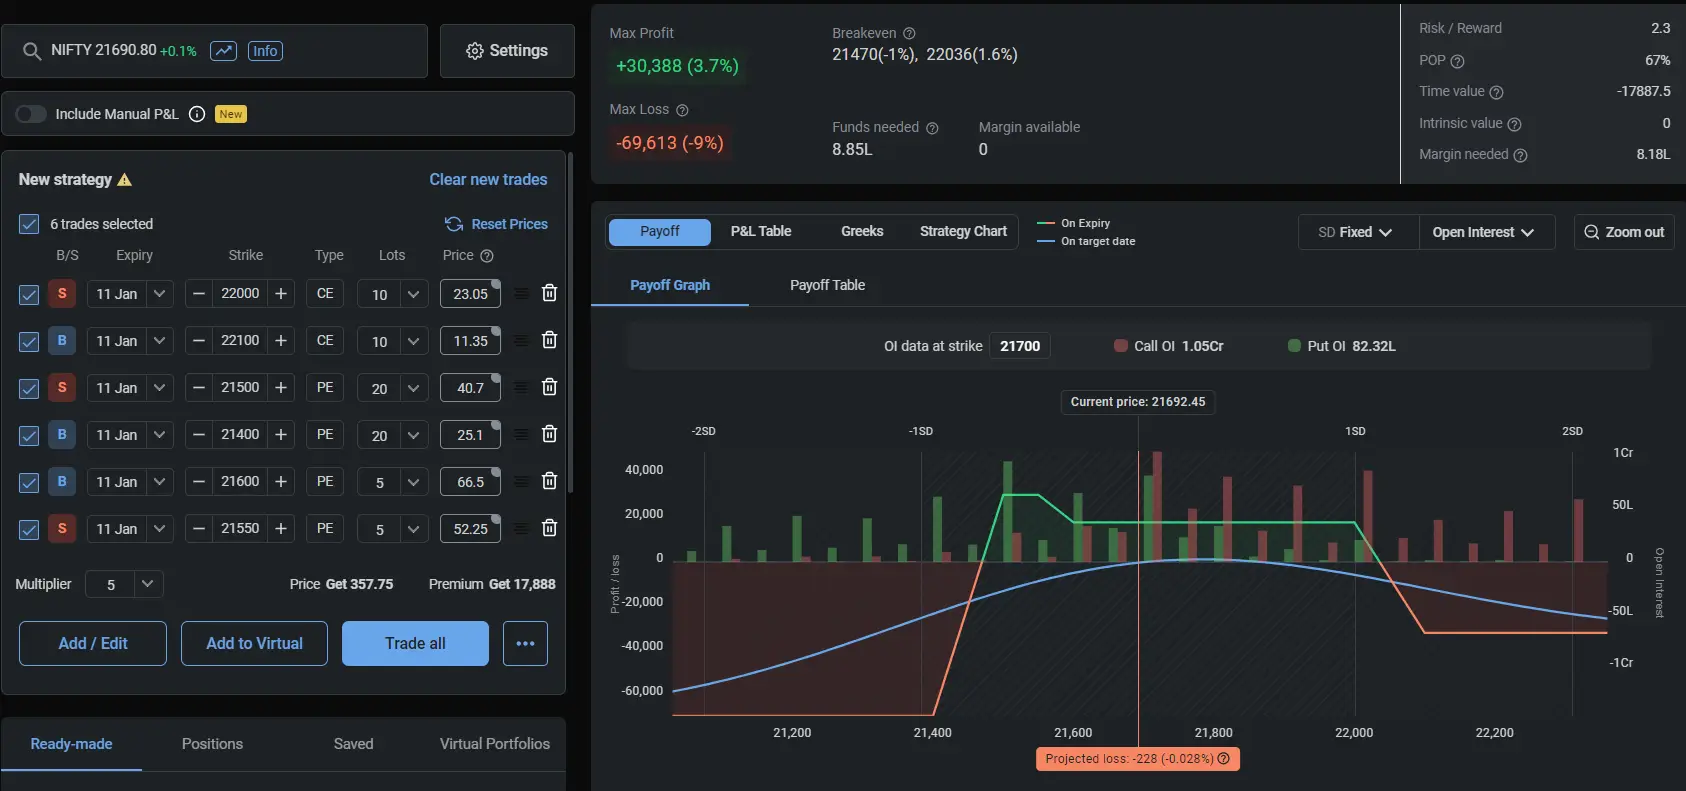
Possible adjustments:
Initially, you can keep a stop loss of 21500 & 22000 for this strategy. Means square off if you find nifty is giving a breakout or breakdown. Or you can make this adjustment too.
If you find that Nifty is giving a breakdown and sustaining below 21500, then square off the call spread and bring it down to 350 points lower levels.
For Upside, you can convert it into an iron butterfly after a sustainable breakout from 22000.
This strategy and all other positional strategies for weekly strategies are part of our advanced course.
If you want to learn these strategies and their adjustments in more practical ways with live mentorship, You can enrol in our Option Strategies – A Mentorship Program.
Banknifty Weekly analysis with option strategy
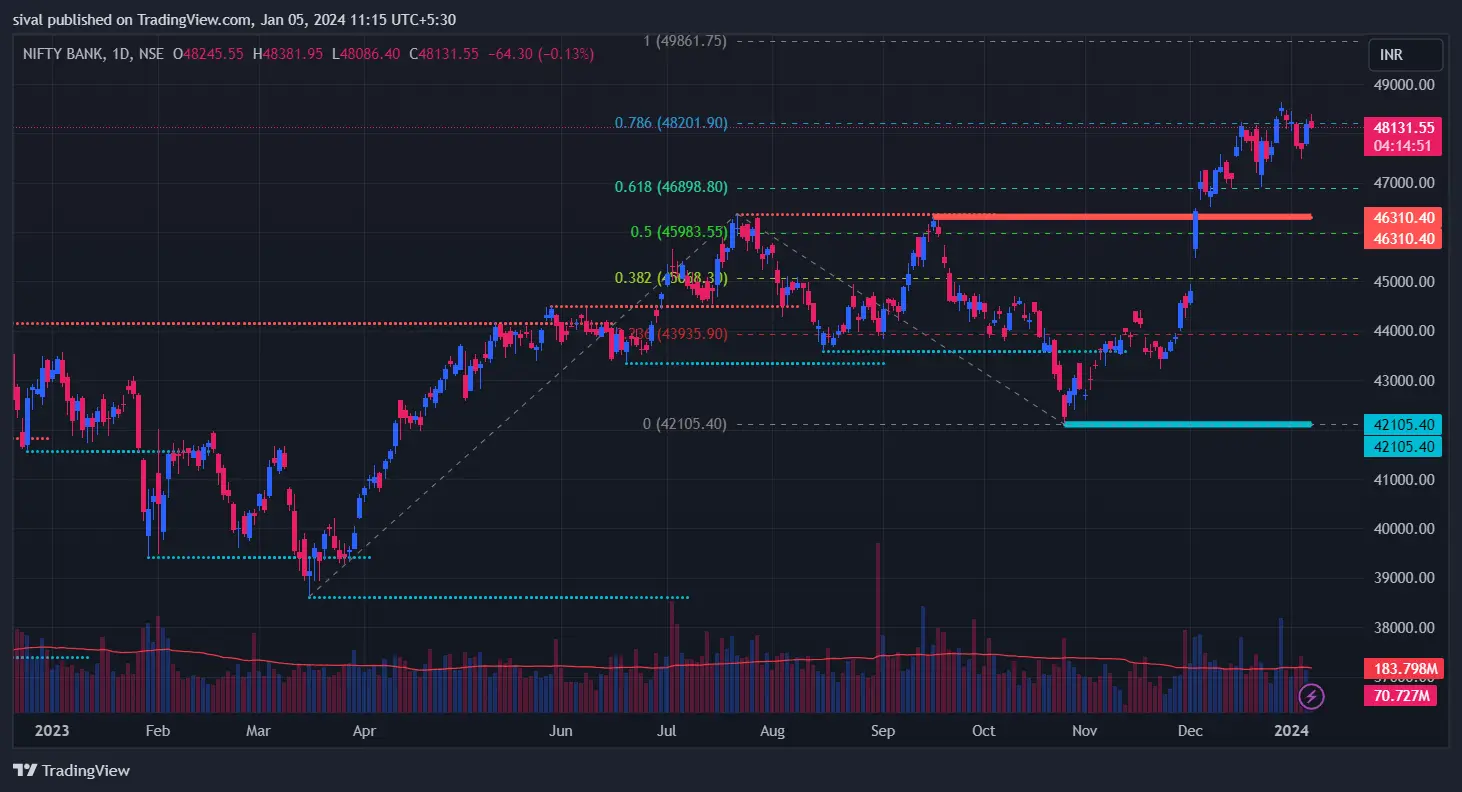
We saw a decent rally in the last few weeks that helped Banknifty to make a new all-time high. But After making an all-time high, we saw some consolidation.
Right now BankNifty is trading in a range of 47500 - 48500. 48200 is very crucial in terms of the short-term trends. A breakout will trigger a fresh BUY signal that leads to a higher level till 49800 in the near term.
On the downside, 46800 to 46000 is a support zone and a breakdown from 46000 will again drag BankNifty in the grip of the bear.
Right now BankNifty is trading in a range with an uptrend, so I suggest you should trade based on the trend only.
Don't try to take a contra-trade and follow trends and levels for further movement.
Bank Nifty Options Chain Analysis
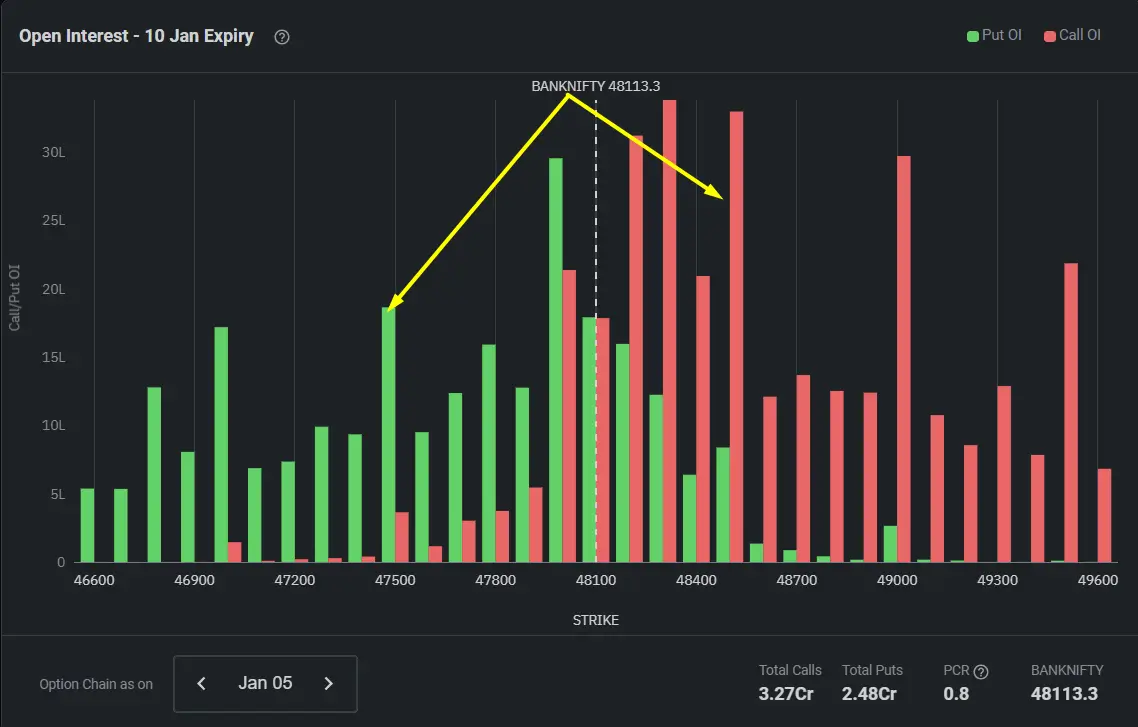
Based on option chain data, the highest Open interest stands at 48300 CE & 48000 PE, followed by 48500 CE & 47500 PE. PCR of all strikes is 0.82, which indicates a neutral market. PCR at 47500 stands at 4.98, which is acting as a strong support level for the current expiry.
The Put-call ratio at 48500 stands at 0.27, which is acting as a resistance level. Equally, important indicator Option Pain is at 48000, indicating weekly expiry at 48000. A shift in option pain will provide further levels.
If you don’t know how to analyze open interest. Just enroll for our Option Strategies – A Mentorship Program.
Bank Nifty Weekly Options Strategy: Bullish Iron Condor
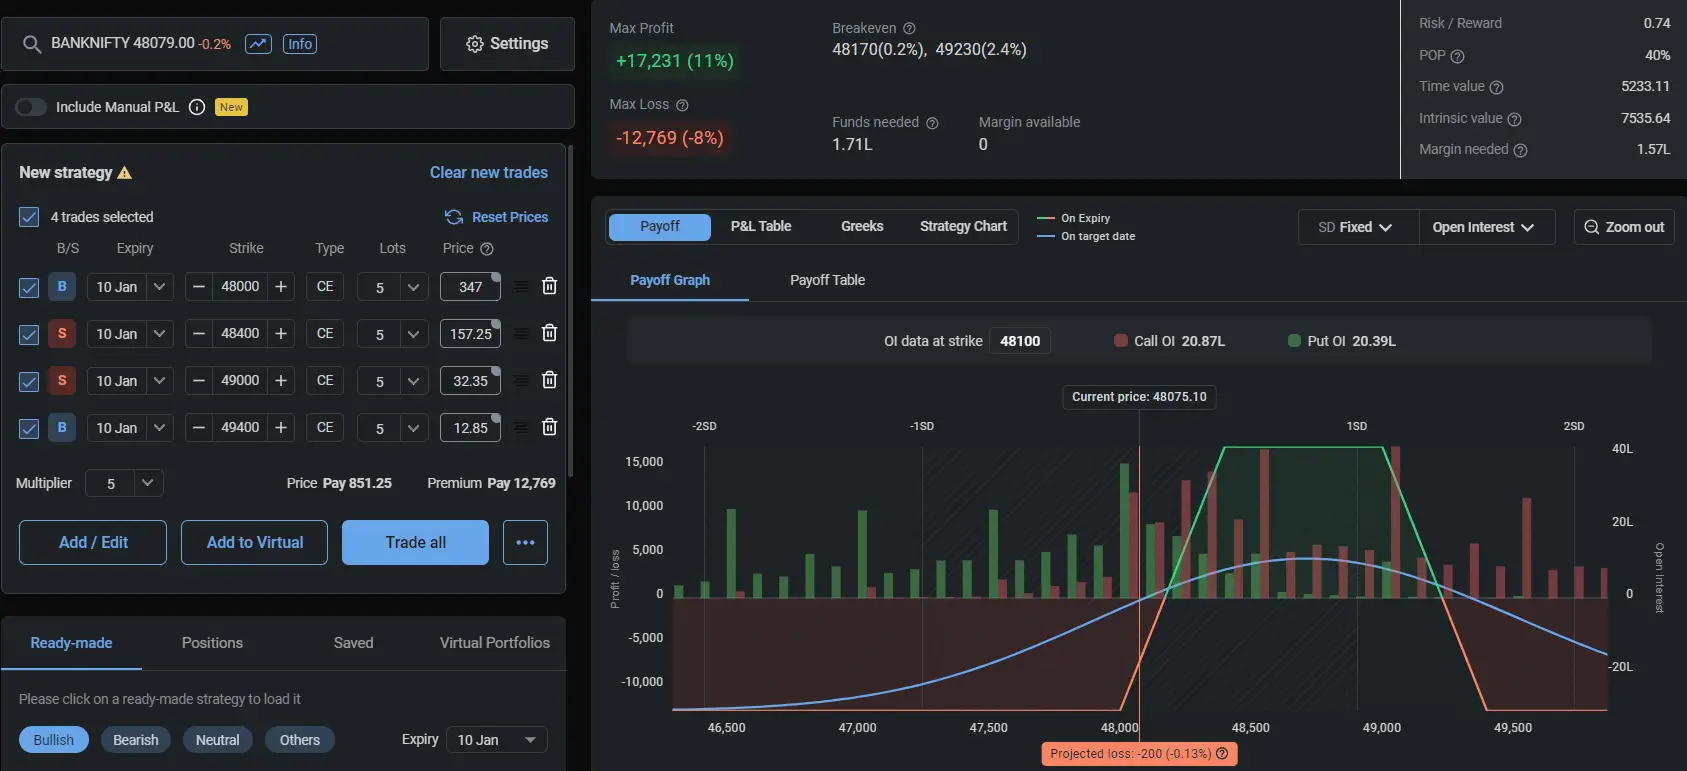
Possible adjustments:
If you find that BankNifty gives a breakdown and sustains below 47800, then Shift your Call spread to 500 points down.
The same thing you can do with put spread means if you got a breakout from 49000. You can shift your put spread to 500 points up.
If you want to learn these Weekly expiry options strategies and their adjustments in more practical ways with live mentorship, You can enrol in our Option Strategies – A Mentorship Program
Post your comments in the comment box if you have a query related to weekly analysis and options strategies. You can ask any question related to options trading in the comment box.
If you need more real-time assistance on Nifty and Bank nifty weekly analysis and options strategies Can take our premium subscription or open a trading account with us and you will get real-time assistance every month on these weekly options strategies. You can contact us on WhatsApp
*( Please avoid any questions like which Call or Put we should buy in the coming week).
Best Bank Nifty Option Buying Strategy
Discover a high-impact BankNifty Options Buying Strategy for intraday trading. Elevate your trading game with TradePik's expert insights and back-tested data. Join the ranks of successful Indian options traders.
Options Strategies – A Mentorship Program
If you’re an options trader looking to take your skills to the next level, then our Options Strategies: A Mentorship Program is the perfect opportunity for you. With our program, you’ll learn advanced option hedging strategies and adjustments through live market support, giving you the hands-on experience you need to succeed.
By signing up for our program, you’ll gain access to a team of experienced options traders who will guide you every step of the way. You’ll learn how to identify the right options strategies for different market conditions, how to manage risk effectively, and how to adjust your positions as needed.
Plus, with our live market support, you’ll have the opportunity to ask questions and get real-time feedback on your trades. This personalized support will help you develop the confidence and skills you need to take on even the most challenging market conditions.
Don’t miss out on this valuable opportunity to take your options trading to the next level. Sign up for our Options Strategies: A Mentorship Program today and start your journey toward success!
DISCLAIMER: – we are not a SEBI research analyst. Weekly analysis, Views, or options strategies are posted here only for educational purposes. There is no liability whatsoever for any loss arising from the use of this product or its contents. This product is not a recommendation to buy or sell, but rather a guideline to interpreting specified analysis methods. This information should only be used by investors and traders who are aware of the risk inherent in securities trading.